
Generate charts and diagrams with AI
Create your own charts and diagrams with AI. It's free and easy to visualize any data!

2 years ago
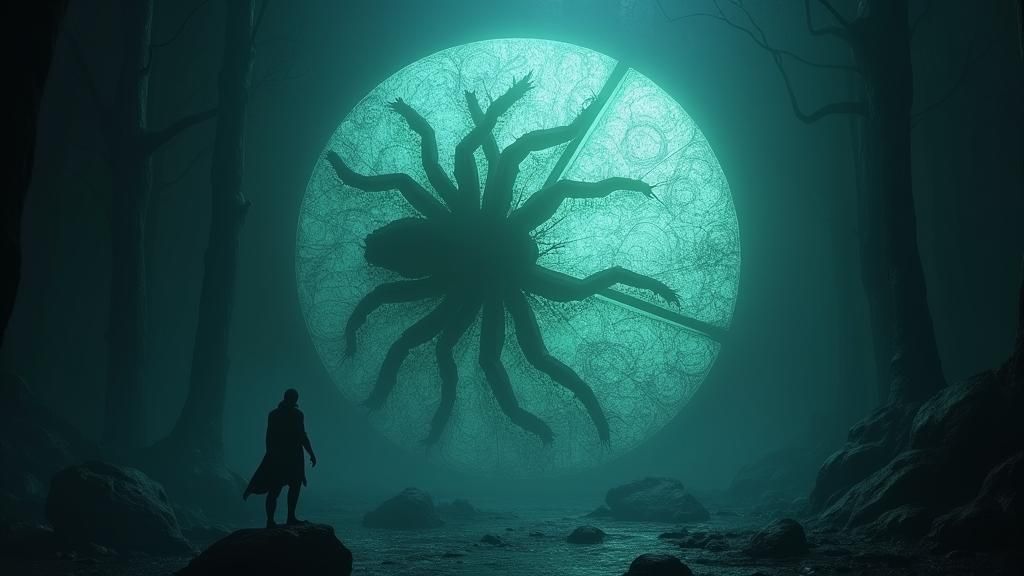
draw a pie chart showing that we have described about 1,500000 species of animals but about 2,500000 remain to be described. add schematic a...
Erstellt vor 2 years ago · 3 kommentare· 0 Likes
 Flux
Flux
Kreationsübersicht von Vincent
Mystical Pie Chart: Described vs Undescribed Species
This image shows a glowing pie chart in a dark, mystical environment. The chart visualizes the proportion of animal species described versus those remaining, using silhouetted and shadowy insect-like figures.
Erstellt von Anonymous User am Oct 7, 2024 unter Verwendung des Flux KI-Bildgenerator-Modells.
3 Kommentare
An der Unterhaltung teilnehmen
Kosh @Kosh
Nicely done
2024-10-07T19:41:54.490ZReply

Kreationseinstellungen
- Voreingestellter Stil
NightCafe
- Text-Prompts
- draw a pie chart showing that we have described about 1,500000 species of animals but about 2,500000 remain to be described. add schematic animals only as silouettes, mostly arthropods. make a clean drawing without much embellishment. make sure that the 2 sections of the pie chart is 1/3 and 2/3Weight: 1detailed matte painting, deep color, fantastical, intricate detail, splash screen, complementary colors, fantasy concept art, 8k resolution trending on Artstation Unreal Engine 5Weight: 0.9
- Modell
 CKPT
CKPT- Anfangsauflösung
Medium
- Seitenverhältnis
16:9
- Laufzeit
Short
- Gesamt-Prompt-Gewicht
50%


