

Generate Power Evolution Charts with AI
Create your own infographic streamgraph charts showing power evolution. It's free and easy with our AI image generator!

2 years ago
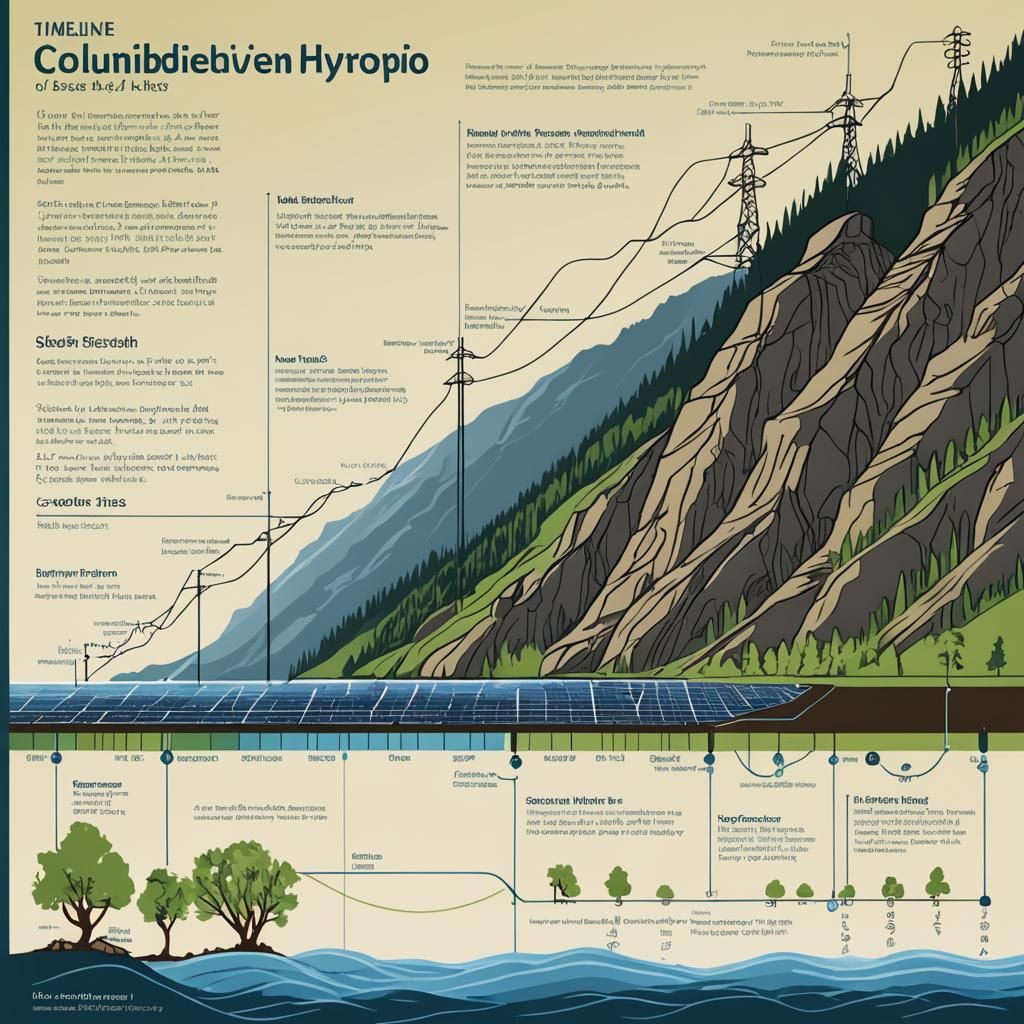
timeline, Columbia River Hydro-Electric solar Power, evolution, infographic streamgraph chart, acrylic ink, sideview,
Dreamshaper XL Lightning

विन्सेंट द्वारा सृजन सारांश
Columbia River Power Evolution: Acrylic Ink Streamgraph
This image depicts a timeline of Columbia River hydro-electric and solar power evolution. The infographic streamgraph chart is rendered with acrylic ink and presented in sideview.
सृजित Jul 26, 2024 को Justin Skeen द्वारा, Dreamshaper XL Lightning एआई छवि उत्पन्न मॉडल का उपयोग करके।
अभी तक कोई टिप्पणी नहीं
पहला उत्तर देने वाला बनें!

No comments yet.
सृजन सेटिंग्स
- प्रॉम्प्ट टेक्स्ट
- timeline, Columbia River Hydro-Electric solar Power, evolution, infographic streamgraph chart, acrylic ink, sideview,Weight: 1
- मॉडल
- प्रारंभिक संकल्प
Medium
- आस्पेक्ट रेश्यो
1:1
- रनटाइम
Long


