

Generate Power Evolution Charts with AI
Create your own infographic streamgraph charts showing power evolution. It's free and easy with our AI image generator!

2 years ago
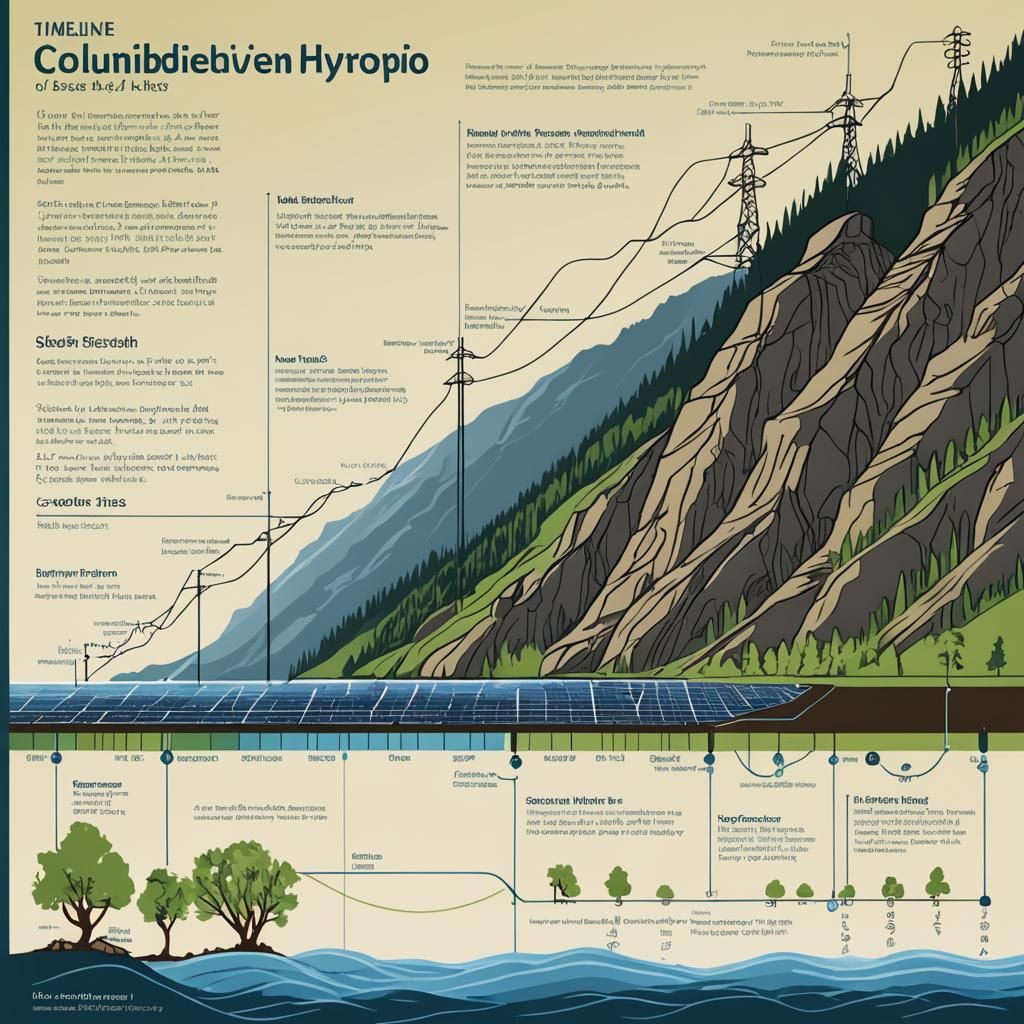
timeline, Columbia River Hydro-Electric solar Power, evolution, infographic streamgraph chart, acrylic ink, sideview,
Creato 2 years ago · 0 commenti· 0 mi piace
Dreamshaper XL Lightning

Riepilogo della creazione di Vincent
Columbia River Power Evolution: Acrylic Ink Streamgraph
This image depicts a timeline of Columbia River hydro-electric and solar power evolution. The infographic streamgraph chart is rendered with acrylic ink and presented in sideview.
Creato da Justin Skeen il Jul 26, 2024 utilizzando il modello di generatore di immagini AI Dreamshaper XL Lightning.
Nessun commento ancora
Sii il primo a rispondere!

No comments yet.
Impostazioni Creazione
- Prompt testuali
- timeline, Columbia River Hydro-Electric solar Power, evolution, infographic streamgraph chart, acrylic ink, sideview,Weight: 1
- Modello
- Risoluzione iniziale
Medium
- Proporzioni
1:1
- Tempo di esecuzione
Long


