

Generate Streamgraph Charts with AI
Make your own timeline, evolution, and infographic streamgraph charts for free with our AI image generator!

2 years ago
timeline, evolution, infographic streamgraph chart, Cascade Mountains,
Criado 2 years ago · 0 comentário· 0 curtida
Dreamshaper XL Lightning

Resumo da criação por Vincent
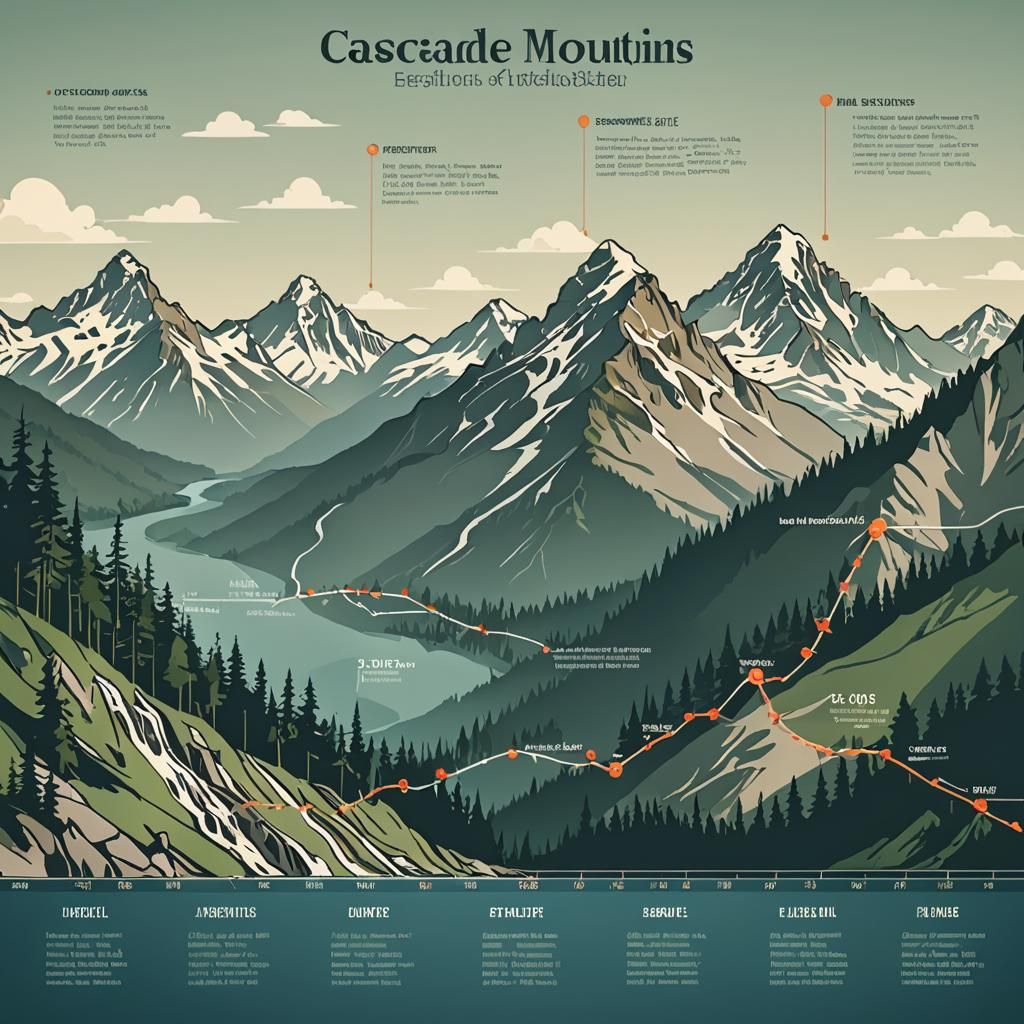
Cascade Mountains Evolution Streamgraph Infographic
This image shows an infographic streamgraph chart depicting the evolution of the Cascade Mountains over a timeline. The chart visualizes changes and trends.
Criado por Justin Skeen em Jul 26, 2024 usando o modelo Dreamshaper XL Lightning gerador de imagens AI.
Nenhum comentário ainda
Seja o primeiro a responder!

No comments yet.
Configurações de Criação
- Prompts de texto
- timeline, evolution, infographic streamgraph chart, Cascade Mountains,Weight: 1
- Modelo
- Resolução inicial
Medium
- Proporção
1:1
- Tempo de execução
Long


